ISRO & Indian Space Program: News & Discussions

  • Thread starter Thread starter Tarun
  • Start date Start date
  • Tags Tags
    isro
https://x.com/ispaceflight_in/status/2103705902658580711

ISRO Chairperson Dr. V. Narayanan shared ISRO's launch targets for 2026-27 during his Institute Lecture at IIT Delhi on 23 September 2026. Here is what the slide shows.Upcoming missions:
1. GSLV F18 | NVS-03 | Oct 2026
2. SSLV L1 | NSIL (NGEs) | Oct 2026
3. HLVM3 | Gaganyaan G1 (uncrewed) | Nov 2026
4. PSLV C63 | TDS-01 | Nov 2026
5. LVM3 M7 | GSAT-N3 | Dec 2026
6. PSLV N1 | Oceansat-3A | Jan 2027
7. SSLV L2 | NSIL (SBS-3) | Mar 2027

What do NGEs and SBS-3 mean?

NGEs (Non-Governmental Entities) is the term ISRO and IN-SPACe use for private companies and startups in India's space sector. "NGE Launch" for Vikram-I means a launch by a private company, not ISRO. "SSLV L1 / NSIL (NGEs)" is a commercial SSLV flight run through NSIL, ISRO's commercial arm, that will most likely carry satellites built by private Indian companies.

SBS-3 (Space Based Surveillance Phase 3) is India's military surveillance satellite program, approved in October 2024. It plans a constellation of about 52 satellites for defence and border monitoring, built partly by ISRO and partly by private industry. The SSLV L2 flight in March 2027 would likely launch satellites from this constellation.

Last time, we reported that ISRO was targeting 6 more launches this financial year, while an RTI reply put the number at 5. This slide now lists 7 launches from October 2026 to March 2027. It also fills in the payloads we had marked as TBD: TDS-01 on PSLV C63, GSAT-N3 on LVM3 M7, and SBS-3 on the second SSLV commercial flight.

As always, these are targets. Launch dates can shift, so take them with a grain of salt.​

What is most important is that ISRO carries out a successful launch of PSLV , which suffered 2 consecutive failures
 

First Joint View by Coronagraphs on India's Aditya-L1 and Europe's Proba-3 Decodes Solar Eruptions Near Their Birthplace

October 15, 2026

For the first time, scientific observations of the same solar eruptions by India's Aditya-L1 mission and Europe's Proba-3 have been jointly analyzed and published. Scientists at the Indian Institute of Astrophysics (IIA), Bengaluru, combined observations from the VELC payload onboard Aditya-L1 and the ASPIICS payload onboard Proba-3 to study coronal mass ejections (CMEs). They measured the mass, density, and energetics of these CMEs in the region very close to the Sun. The study has been published in the prestigious journal Astronomy & Astrophysics.

Why it matters:

CMEs are large eruptions from the Sun in which huge amounts of magnetized plasma are thrown out into interplanetary space. When such eruptions are directed towards Earth, they can disturb the near-Earth space environment. Measurements of CME parameters near the Sun are very valuable for understanding the physical processes that shape CME properties and subsequent evolution. However, observing CMEs very close to the solar disk is challenging, and earlier space coronagraphs only partially succeeded in observing them and could not track the early evolution of faint CMEs. As a result, how CME energy is shared between kinetic, thermal, and magnetic in the inner corona has remained poorly constrained. Combining Aditya-L1/VELC and Proba-3/ASPIICS shows potential for a better understanding of it.

Aditya-L1, India's first dedicated solar mission, was launched by PSLV-C57 on 2 September 2023. The spacecraft was successfully placed in a halo orbit around the Sun—Earth L1 point on 6 January 2024. This special vantage point facilitates uninterrupted observation of various solar phenomena. The Visible Emission Line Coronagraph (VELC) was developed by IIA, Bengaluru, in close collaboration with ISRO. VELC takes the spectroscopic observations of the solar corona from 1.05 to 1.5 solar radii in the 5303 Angstrom green coronal line.

Proba-3, a mission of the European Space Agency (ESA), was launched by PSLV-XL from Sriharikota on 5 December 2024. It is the world's first precision formation-flying mission. Two spacecraft fly about 150 meters apart, and one casts a shadow on the other. This creates an artificial solar eclipse in space, allowing the ASPIICS coronagraph onboard Proba-3 to image the corona from about 1.1 to 3 solar radii in white light and in the 5303 Angstrom green coronal line.

Working together:

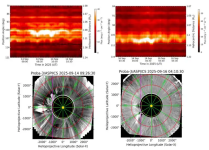
The coronagraph onboard Aditya-L1 (VELC) and Proba-3 (ASPIICS) conducted joint observations of almost the same part of the solar corona in two different types of observations (spectroscopic from VELC and imaging from ASPIICS). These joint observations provide deeper insights into CME evolution than observations from a single spacecraft alone. ASPIICS white-light and green coronal emission line observations provide sharp images that enable accurate estimates of a CME's shape, dynamics, and mass. VELC spectroscopic observations in the green coronal emission line provide information on CME gas at about two million degrees. This gives independent estimates of the CME's density and thermal energy. The two instruments share a common field of view in the low corona. The team found that only two CMEs, on 14 and 16 September, were recorded simultaneously by VELC and ASPIICS from July to December 2025. In both cases, VELC caught the eruptions at an early stage, demonstrating how the two instruments complement each other.

1792167562552.png
Figure: Coordinated observations of two coronal mass ejections (CMEs) on 14 September 2025 (left) and 16 September 2025 (right). The upper panels show the increase in coronal emission recorded by Aditya-L1/VELC as the CMEs passed through the inner corona. The lower panels show the corresponding CMEs observed in white light by Proba-3/ASPIICS.

Key findings:
  • Two CMEs, two behaviors: The 14 September CME was fast (about 645 km/s), while the 16 September CME was much slower (145 km/s). The density of the 16 September CME dropped more steeply with height than that of another CME, indicating its stronger early expansion.
  • Independent checks agree: Estimates of mass and thermal energy from ASPIICS and VELC agree well, despite the two instruments using different geometric assumptions, physical considerations, and observation types.
  • Different energy partitioning: In the 14 September 2025 CME, thermal energy was only about 1% of the total. In the 16 September 2025 CME, thermal energy grew until it matched kinetic energy. The estimated magnetic energy is comparable to or greater than the kinetic energy.
The results demonstrate the scientific potential of synergetic ASPIICS and VELC observations to constrain the CME mass, density, and energetics in the inner corona, thereby providing new observational constraints on the early evolution of CMEs. The study shows that pairing a coronagraph that images the corona with one that measures its spectrum yields a more complete, cross-checked view of the origin and evolution of CMEs.

This study was led by researchers from the Indian Institute of Astrophysics along with other European and American solar physicists. The work shows the growing scientific impact of Aditya-L1 and the strength of coordinated observations and associated international cooperation in solar astrophysics and space science.

Reference: Agarwal, A., Mishra, W., Ramesh, R., et al. (2026). Coordinated coronagraphic observations from Proba-3 and Aditya-L1: Investigating coronal mass ejection energetics in the inner corona. Astronomy & Astrophysics.
https://doi.org/10.1051/0004-6361/202661733
First Joint View by Coronagraphs on India's Aditya-L1 and Europe's Proba-3 Decodes Solar Eruptions Near Their Birthplace
 
  • Like
Reactions: Parthu
SPADEX Satellites Re-entry into Earth’s Atmosphere on October 12, 2026

October 23, 2026

ISRO achieved a historic milestone with the successful launch of the Space Docking Experiment (SPADEX) onboard PSLV-C60 mission in 470 km circular orbit of 550 inclination on December 30, 2024. The mission demonstrated critical autonomous rendezvous and low-impact docking technologies using the two satellites, SPADEX-A and SPADEX-B.

Throughout the mission, both spacecraft successfully accomplished all core objectives including vertical and radial docking, composite control, power transfer, undocking, and payload operations. Further circumnavigation was also demonstrated successfully.

Post operational phase, the fuel was exhausted in both the satellites, their orbits decayed progressively, leading to their eventual atmospheric re-entry on October 12, 2026. Two moderate geomagnetic storms on 4th and 11th October 2026 accelerated the orbital decay.

Meticulous mission management and operations ensured that both the spacecraft remained healthy until the reception of final telemetry frames.

The impact point of SPADEX-A was over South Pacific Ocean around 16:48 UTC, on October 12, 2026. The final impact of SPADEX-B was over the North Atlantic Ocean around 23:36 UTC, on October 12, 2026 after re-entry to Earth’s atmosphere.

SPADEX Satellites Re-entry into Earth’s Atmosphere on October 12, 2026
 
$1.3 Billion Indo-US Satellite Saw Nepal Disaster Coming. But No One Saw It

Experts say merely putting what can only be called 'White Elephants' in the sky is not good enough; one needs human intelligence combined with artificial intelligence to accurately issue early warnings.

Reported by Pallava Bagla
World News
Oct 24, 2026 13:45 IST
1792872498436.png
The real mystery is why nobody was watching the data as it was beamed down every 12 days.

New Delhi:
The world's single most expensive civilian Indo-US Earth imaging satellite, NISAR, costing $1.3 billion, saw the warning signs in the Nepal Himalayas. But nobody was watching, and hence no warning was issued.

Experts say merely putting what can only be called 'White Elephants' in the sky is not good enough; one needs human intelligence combined with artificial intelligence to accurately issue early warnings. After all, over a billion human lives are at risk in the northern Indian plains, and NISAR still has four years of life left to redeem itself.

The real mystery is why nobody was watching the data as it was beamed down every 12 days. The evidence was embedded in the voluminous data, but neither ISRO nor NASA connected the dots. Here is a plaintive chronicling of the lessons from NISAR's unheard alert.

The devastating Nepal Rasuwa flash flood of August 26 is emerging as a defining lesson for scientists, disaster managers and governments across the Himalayan region. The world's single most expensive civilian Earth observation satellite, the $1.3 billion NASA-ISRO Synthetic Aperture Radar (NISAR) mission, had in fact detected subtle movements in the glacier and rock mass that ultimately collapsed as it was supposed to do. But the signals were only discovered after the disaster, underscoring a hard truth of modern Earth observation: detecting danger is one thing; continuously monitoring and interpreting enormous volumes of satellite data in real time and issuing a timely warning is quite another.

Hence, some are dubbing the 2393 kg NISAR satellite launched on July 30, 2025, from Sriharikota a white elephant in the sky.

1792872577456.png

The findings come from the first scientific paper published on the Nepal disaster by 12 scientists from ISRO's National Remote Sensing Centre (NRSC), Hyderabad. The study reconstructs the entire chain of events that led to one of the deadliest Himalayan disasters in recent memory and reveals that NISAR had detected "precursory movement" in the mountains weeks before the catastrophic collapse. But no one took heed.

On the morning of August 26, a massive section of glacier ice and permafrost rock detached from a hanging glacier north of Langtang Lirung peak in Nepal at an altitude of about 5,130 metres. The collapse triggered a gigantic rock-ice avalanche that rapidly transformed into a flood and debris flow racing through the Lhende Khola and Trishuli river systems. The resulting devastation spread across a 72-kilometre stretch of river valley, destroying roads, bridges, buildings, tunnels and critical infrastructure in Nepal and along the Nepal-China border trade corridor.

According to figures cited in the latest ISRO study from Nepal's National Disaster Risk Reduction and Management Authority, the disaster had claimed 1,451 lives, while 5,745 people remained missing as of September 21, 2026. Additional fatalities were also reported in the Tibet Autonomous Region of China.

Satellite analysis showed that the initial collapse involved an astonishing 99 million cubic metres of rock and ice. To put that in perspective, the volume was equivalent to about 115 Empire State Buildings crashing down a Himalayan mountainside almost simultaneously.

What made the event so destructive was not merely the size of the collapse but the enormous release of energy. The detached mass plunged about 1,300 metres from the source region to the glacier valley floor before continuing downslope through an additional vertical drop of nearly 870 metres. In total, the debris mass descended roughly 2,170 metres. That immense loss of elevation converted gravitational potential energy into kinetic energy, accelerating and pulverising the rock and ice into a highly mobile mixture of debris, water and meltwater capable of tearing through a narrow valley in minutes.

The paper published in the Journal of Indian Society of Remote Sensing describes how the avalanche travelled nearly 5.9 kilometres along the valley floor, entraining additional snow, glacier ice, rocks and sediments before transforming into a devastating flash flood. Scientists also recorded a secondary landslide about three hours later, which further complicated the disaster by creating a debris-dammed lake.

The latest paper also states that the earthquake signature detected at 8.22 AM Indian time was an acoustic signal of the rock avalanche coming down with a huge impact, and the earthquake did not trigger the rock-ice avalanche.

The most significant scientific revelation, however, comes from NISAR.

The satellite was launched with considerable expectations because of its ability to measure movement of the Earth's surface with extraordinary precision. It has often been described as capable of detecting ground motion down to millimetre scales. Monitoring glaciers, glacier dynamics, land deformation and natural hazards across mountain regions such as the Himalayas is one of its important objectives.

1792872623094.png

The NRSC study found that NISAR's L-band radar data covering the period from June 20 to August 19, 2026 clearly identified an unstable high-velocity zone exactly where the catastrophic collapse later occurred. The results showed accelerating deformation and creep in the escarpment section before failure. In the final monitoring interval between July 26 and August 19, displacement vectors became larger, more coherent, and spread across much of the eventual collapse zone. Some pixels recorded cumulative horizontal offsets exceeding five metres.

The data effectively captured the mountain moving before it broke apart. But the warning remained buried within the vast ocean of satellite observations.

Researchers note that the unstable zone became obvious when compared with post-disaster imagery. In other words, the signal existed before the event, but it was recognised only through post-facto analysis.

NASA's Jet Propulsion Laboratory in California, in a statement to NDTV, said, "The data from NISAR, including what its instruments have collected in the area of the flooding, has been and continues to be freely accessible to the public via the Alaska Satellite Facility Distributed Active Archive Center and ISRO's Bhoonidhi portal. Users can analyze the data to generally assess the risk of future disasters."

While ISRO has at least done a post-facto analysis, strangely NASA has not done any analysis of its own on the devastating Nepal floods.

That finding highlights perhaps the most important lesson emerging from the disaster. Satellites like NISAR can map vulnerability, identify unstable slopes, and detect accelerating deformation. They can help determine where danger exists and where risk is increasing. What they cannot currently do is predict the exact moment a glacier or mountain slope will collapse.

The challenge is compounded by scale. The Himalayas stretch across thousands of kilometres and contain 25,000-plus glaciers, hanging valleys, unstable rock faces and permafrost zones. Monitoring every square kilometre continuously would require enormous computing power, advanced artificial intelligence tools and round-the-clock analysis systems capable of processing radar imagery almost in real time.

Scientists also found evidence that climate change may have contributed to the disaster. Using satellite data, they determined that the summer of 2026 was exceptionally warm. Air temperatures remained significantly above the long-term average from 2001 to 2025 and frequently approached or exceeded one standard deviation above normal conditions. Daily temperatures reached between 8 and 9 degrees Celsius, making 2026 one of the warmest years in the 26-year record for the region. Such sustained warmth would have increased glacier melt, generated more meltwater and destabilised slopes already under stress.

The researchers argue that the Nepal disaster is unlikely to be an isolated event. They warn that warming temperatures, melting glaciers and unstable mountain slopes are creating conditions for more such cascading hazards across the Himalayas. Previous disasters, including the Chamoli rock-ice avalanche in Uttarakhand in 2021, pointed in the same direction. The Nepal catastrophe now strengthens the evidence that these events may become increasingly common in a warming world.

For ISRO and disaster management agencies, the study offers a powerful roadmap for the future. The answer is not simply launching better satellites. NISAR has already demonstrated that it can see the warning signs. The next step is building systems capable of continuously monitoring the entire Himalayan region, automatically flagging unusual glacier movements, identifying accelerating creep, and integrating satellite observations with climate, geological, and seismic data.

The Rasuwa flood has shown that satellites can reveal vulnerability. They can identify mountains that are becoming unstable. But predicting exactly when a glacier will break apart and unleash a deadly flood remains beyond the current capability of these eyes in the skies; one needs ground monitoring stations for that.

The world's single most expensive Earth imaging satellite saw the mountain move. The challenge now is ensuring that scientists are watching and offering a precise warning when it does. Bitter lessons were learned since NISAR flagged unusual changes in Nepal's Himalayas. Why did the alarm not ring remains a billion-dollar burning question.

https://www.ndtv.com/world-news/1-3...al-disaster-coming-but-no-one-saw-it-12229195